Optimal
No other observed class has a lower death rate on both axes.
Original analysis · IIHS 2018–2021
Most safety lists show only one side. This original five-chart analysis maps how often the vehicle's own driver dies alongside the death rate of drivers in other vehicles.
The result is not one simplistic winner. It is a landscape of vehicles that protect everyone, endanger everyone, or shift risk from one driver to another.
The strongest outcome is low on both measures. A low driver-death rate alone does not tell you how a vehicle affects another driver in a collision, and an other-driver rate is not a finding of fault.
Original visualization
Each dot is a vehicle class. The colored background compares it with the all-vehicle rates of 38 driver deaths and 53 other-driver deaths per million registered vehicle-years. The lines trace four different Pareto frontiers.
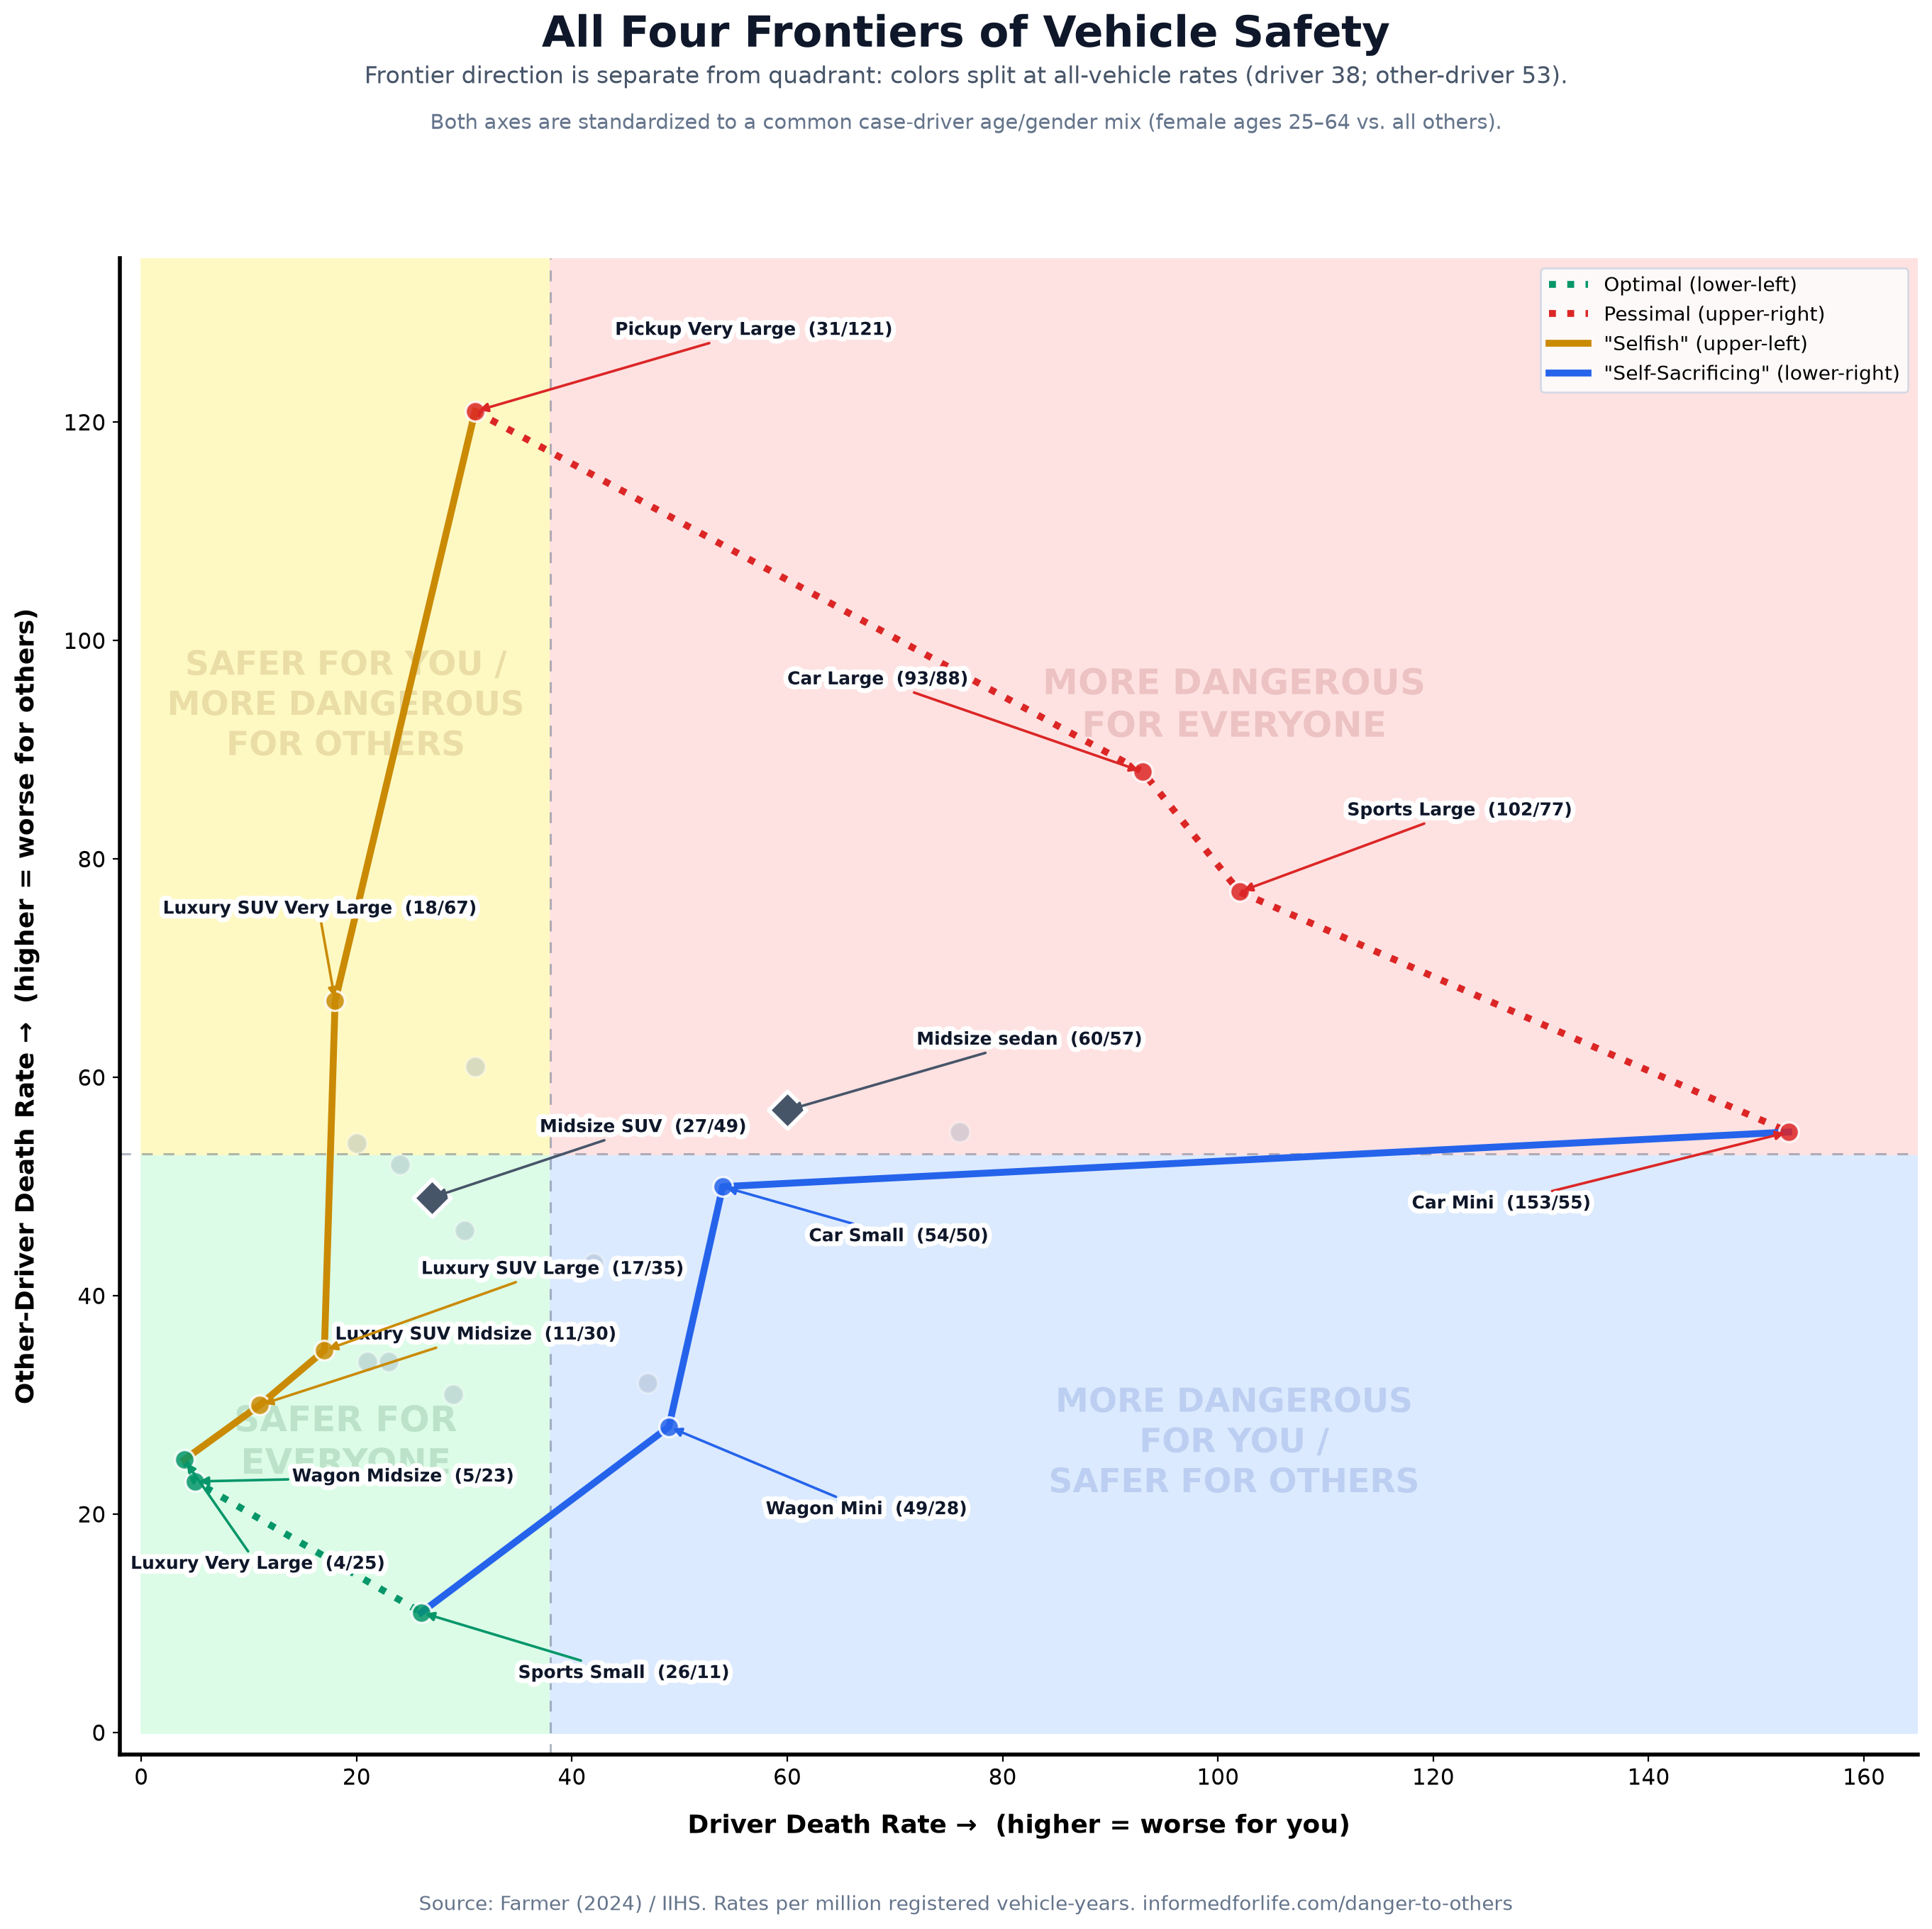
No other observed class has a lower death rate on both axes.
No other observed class has a higher death rate on both axes.
Optimizes toward lower risk for the vehicle's driver and higher risk for the other driver.
Optimizes toward higher risk for the vehicle's driver and lower risk for the other driver.
181 model series · 95% confidence intervals
Point estimates can be noisy when deaths are rare. These four original charts use the conservative ends of IIHS confidence intervals and show both the first and second Pareto tiers. Select any chart to open the original high-resolution PNG.
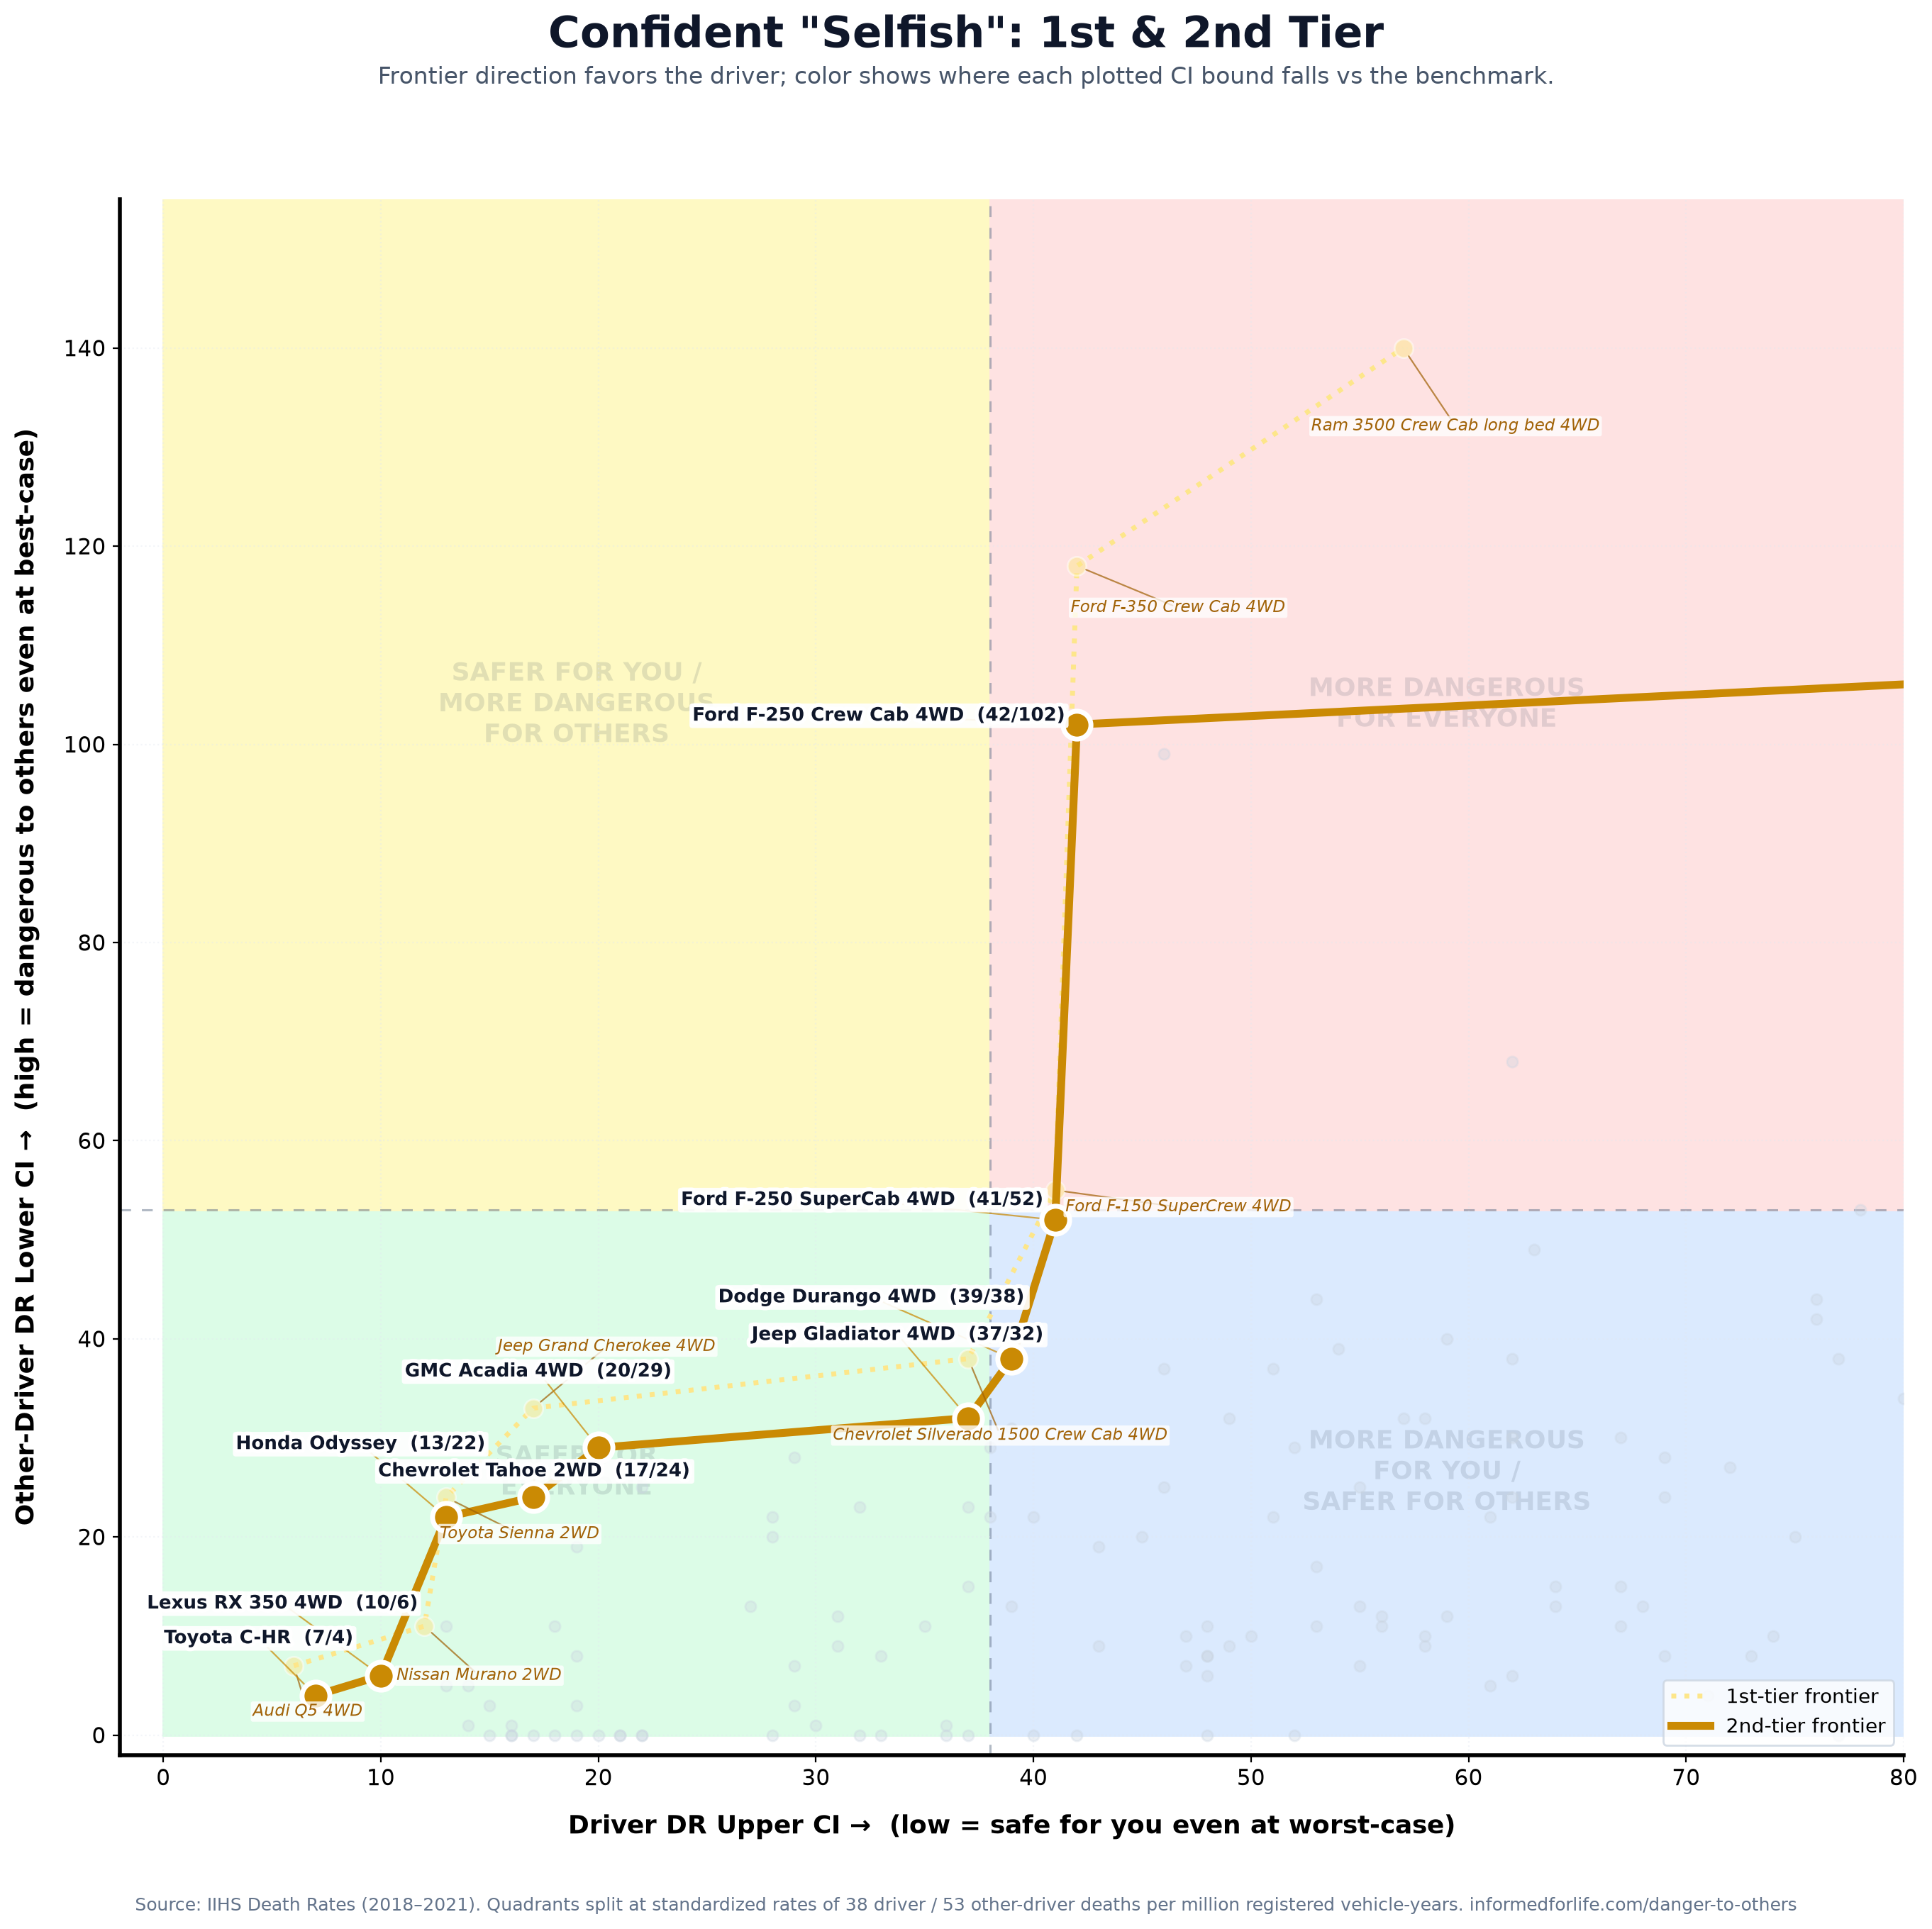
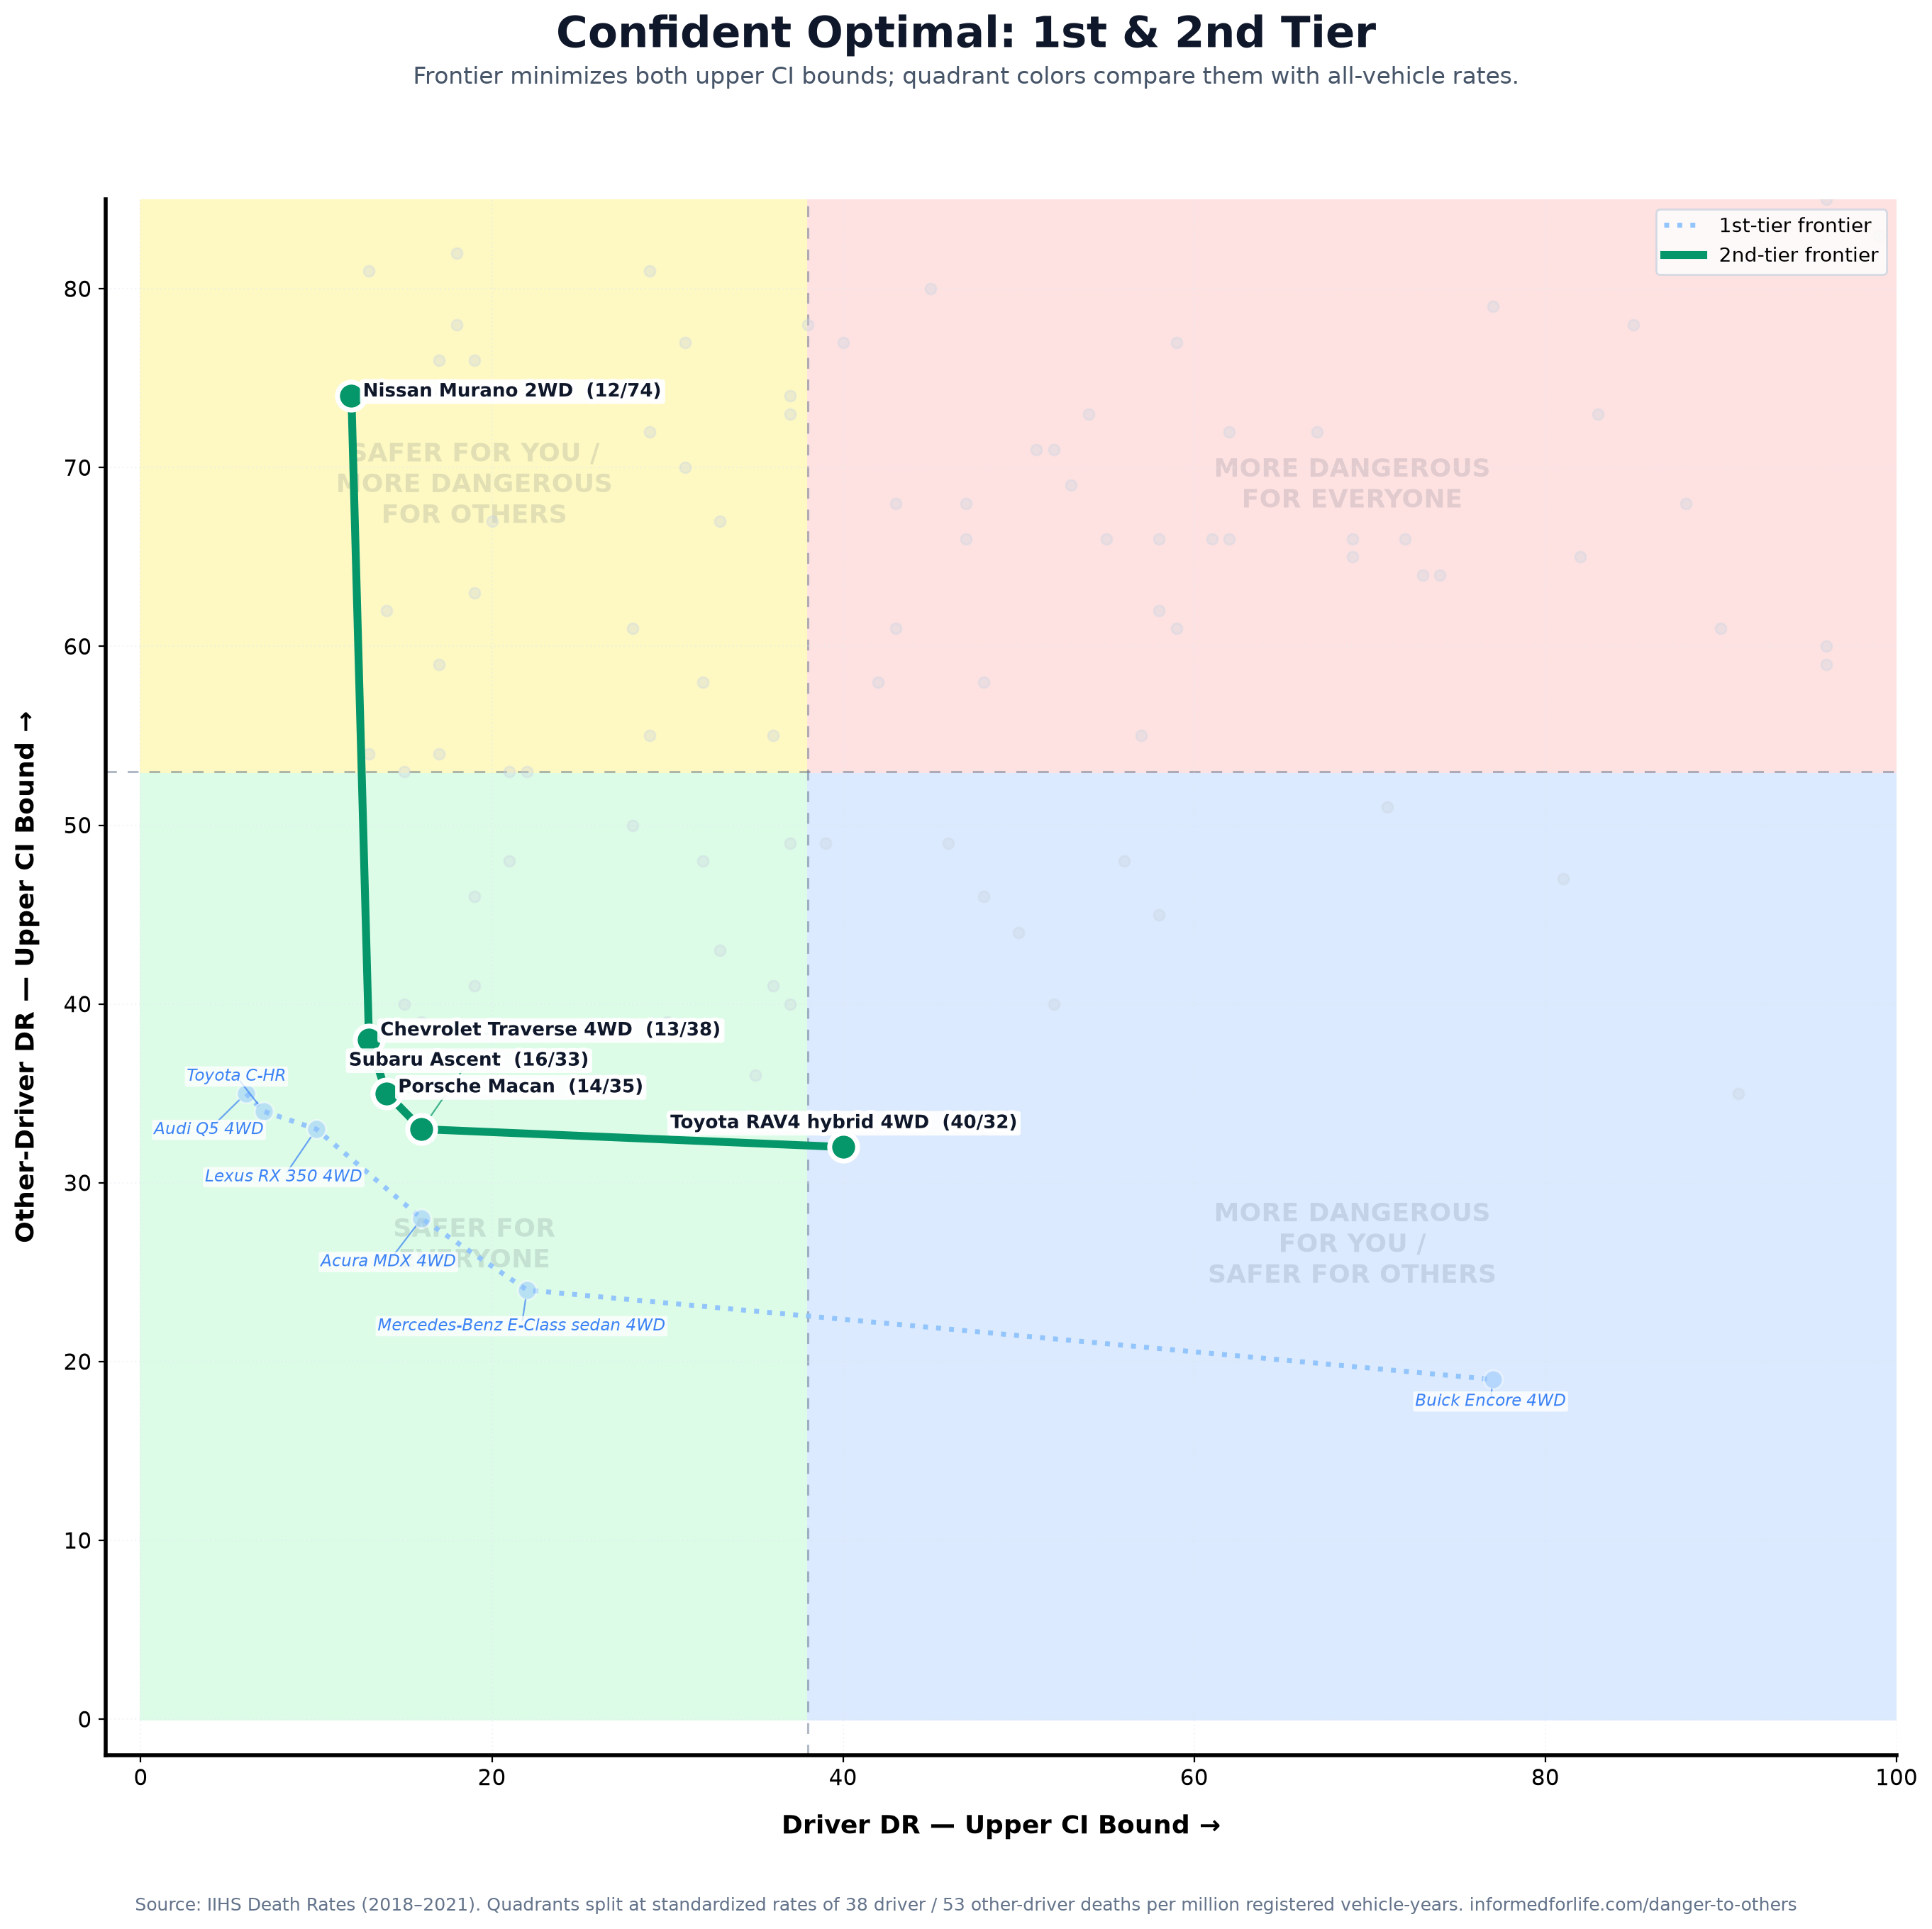
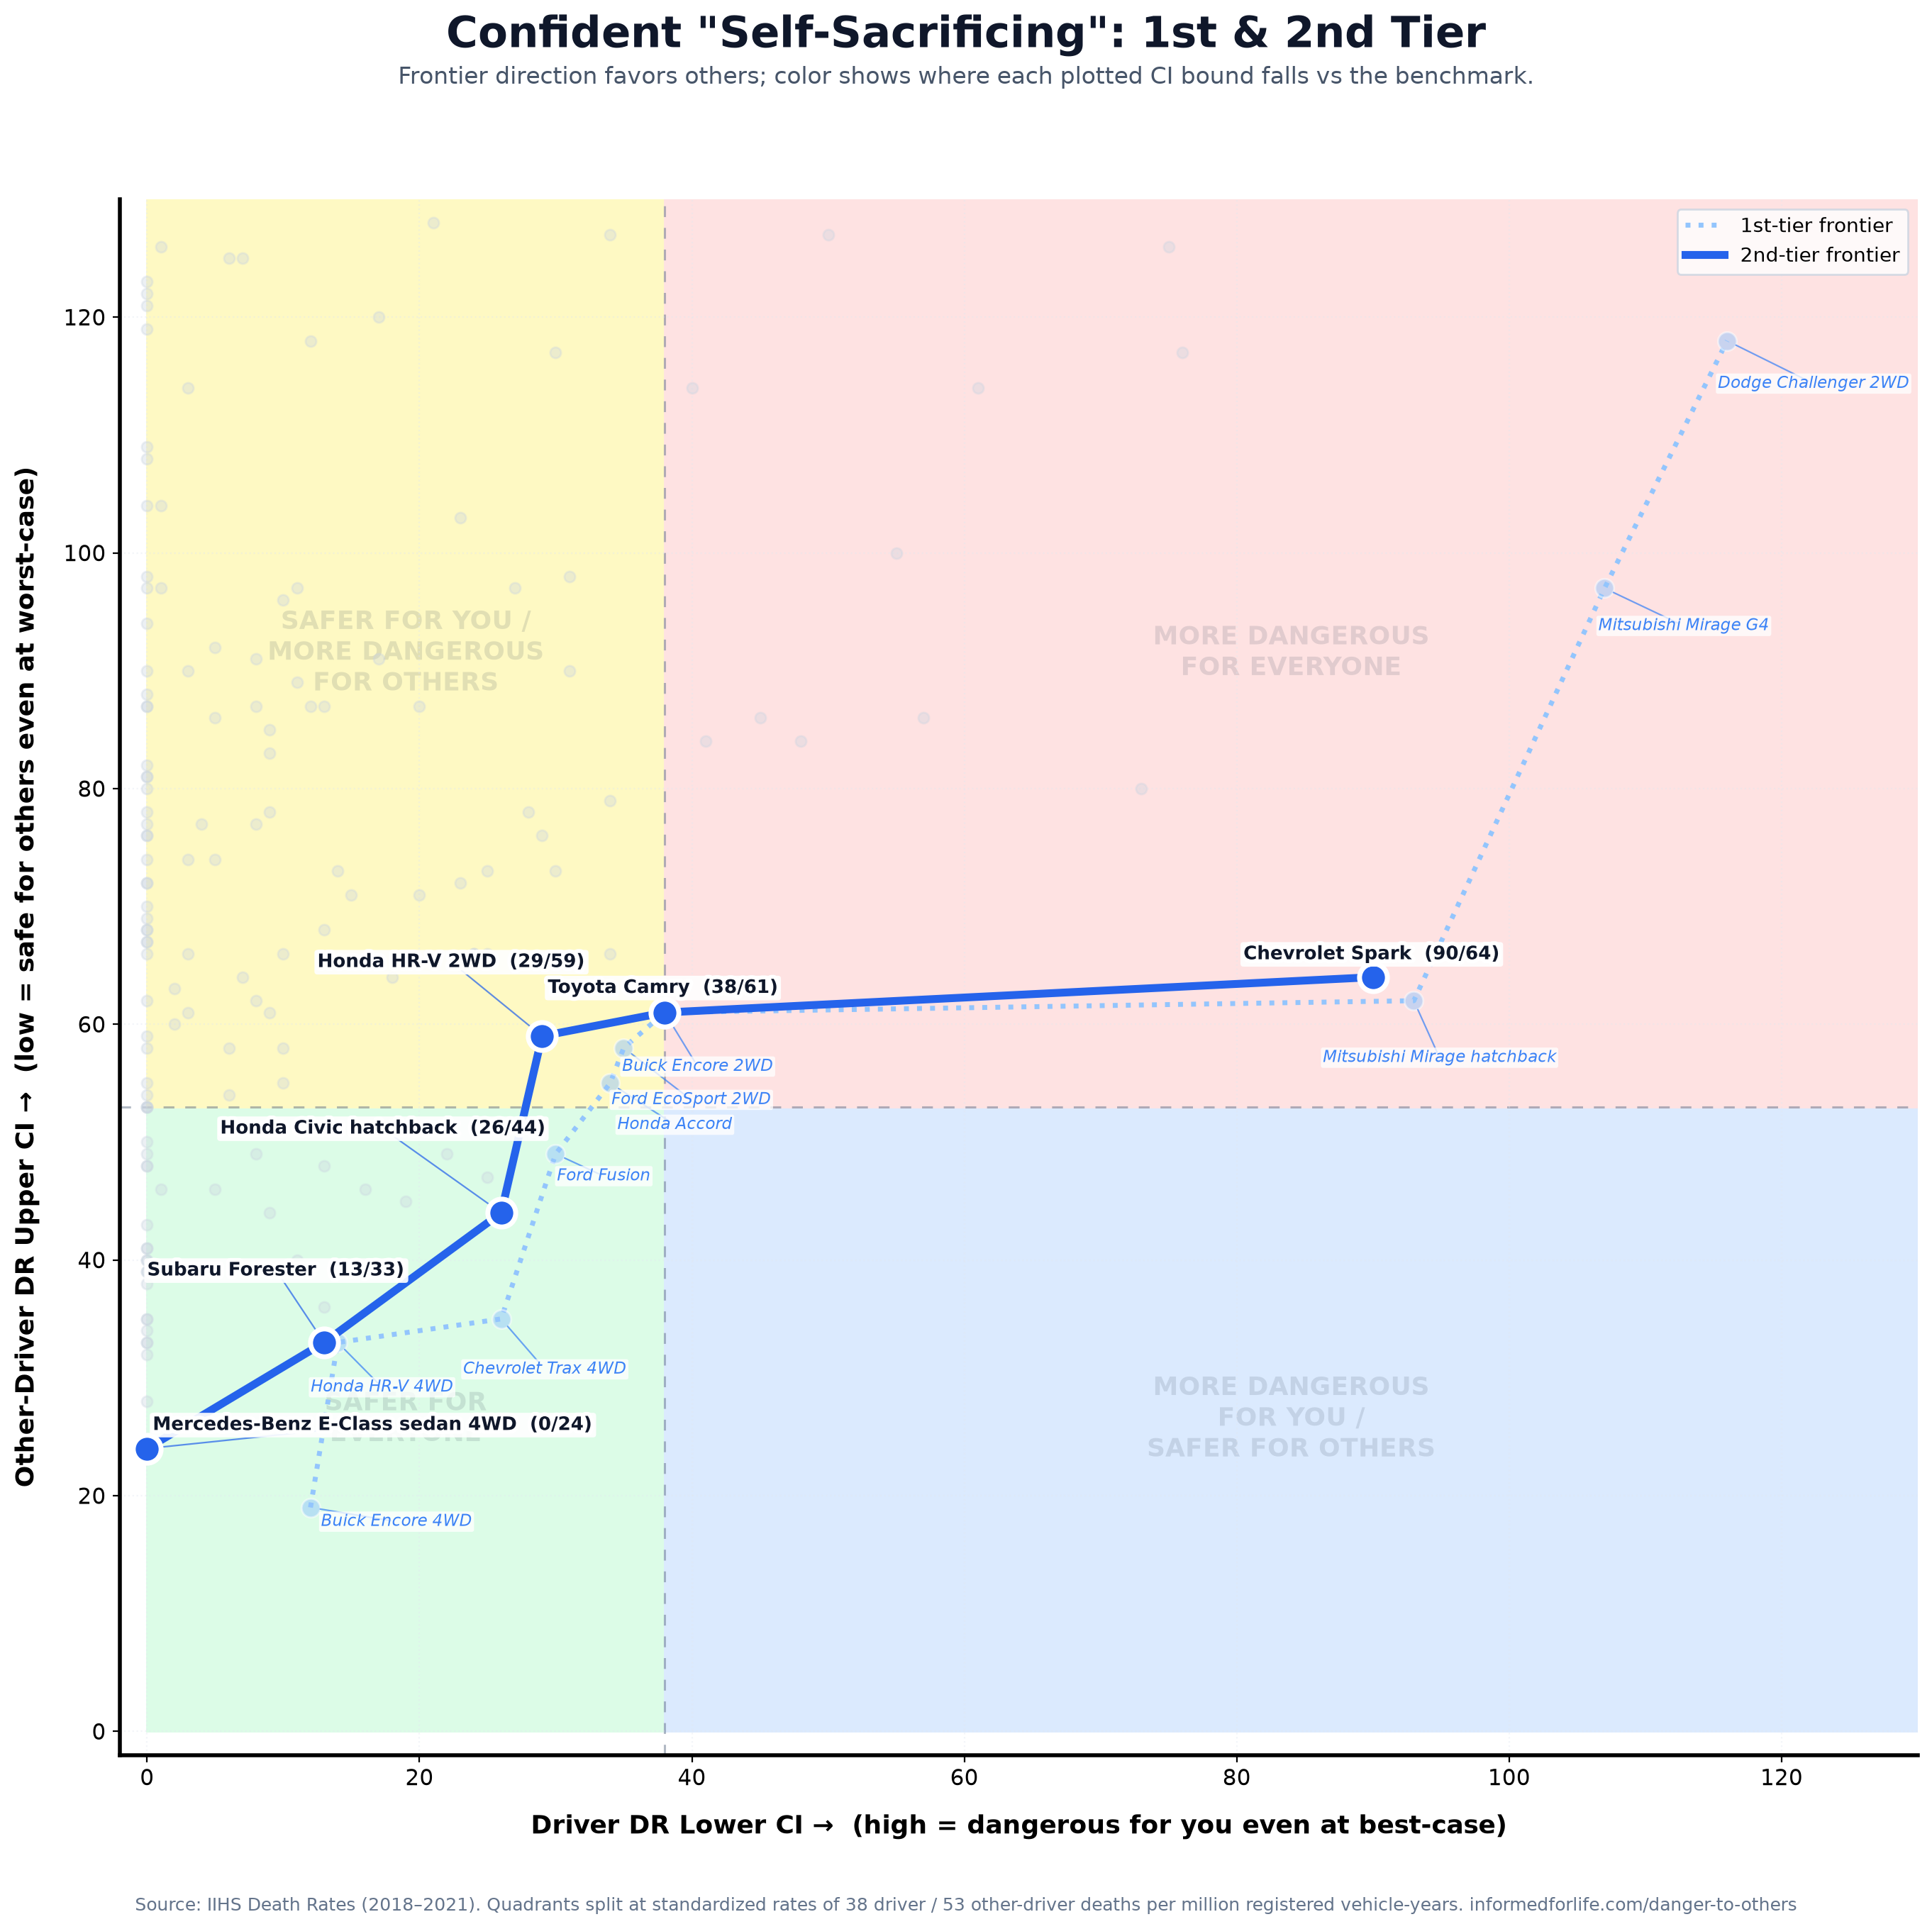
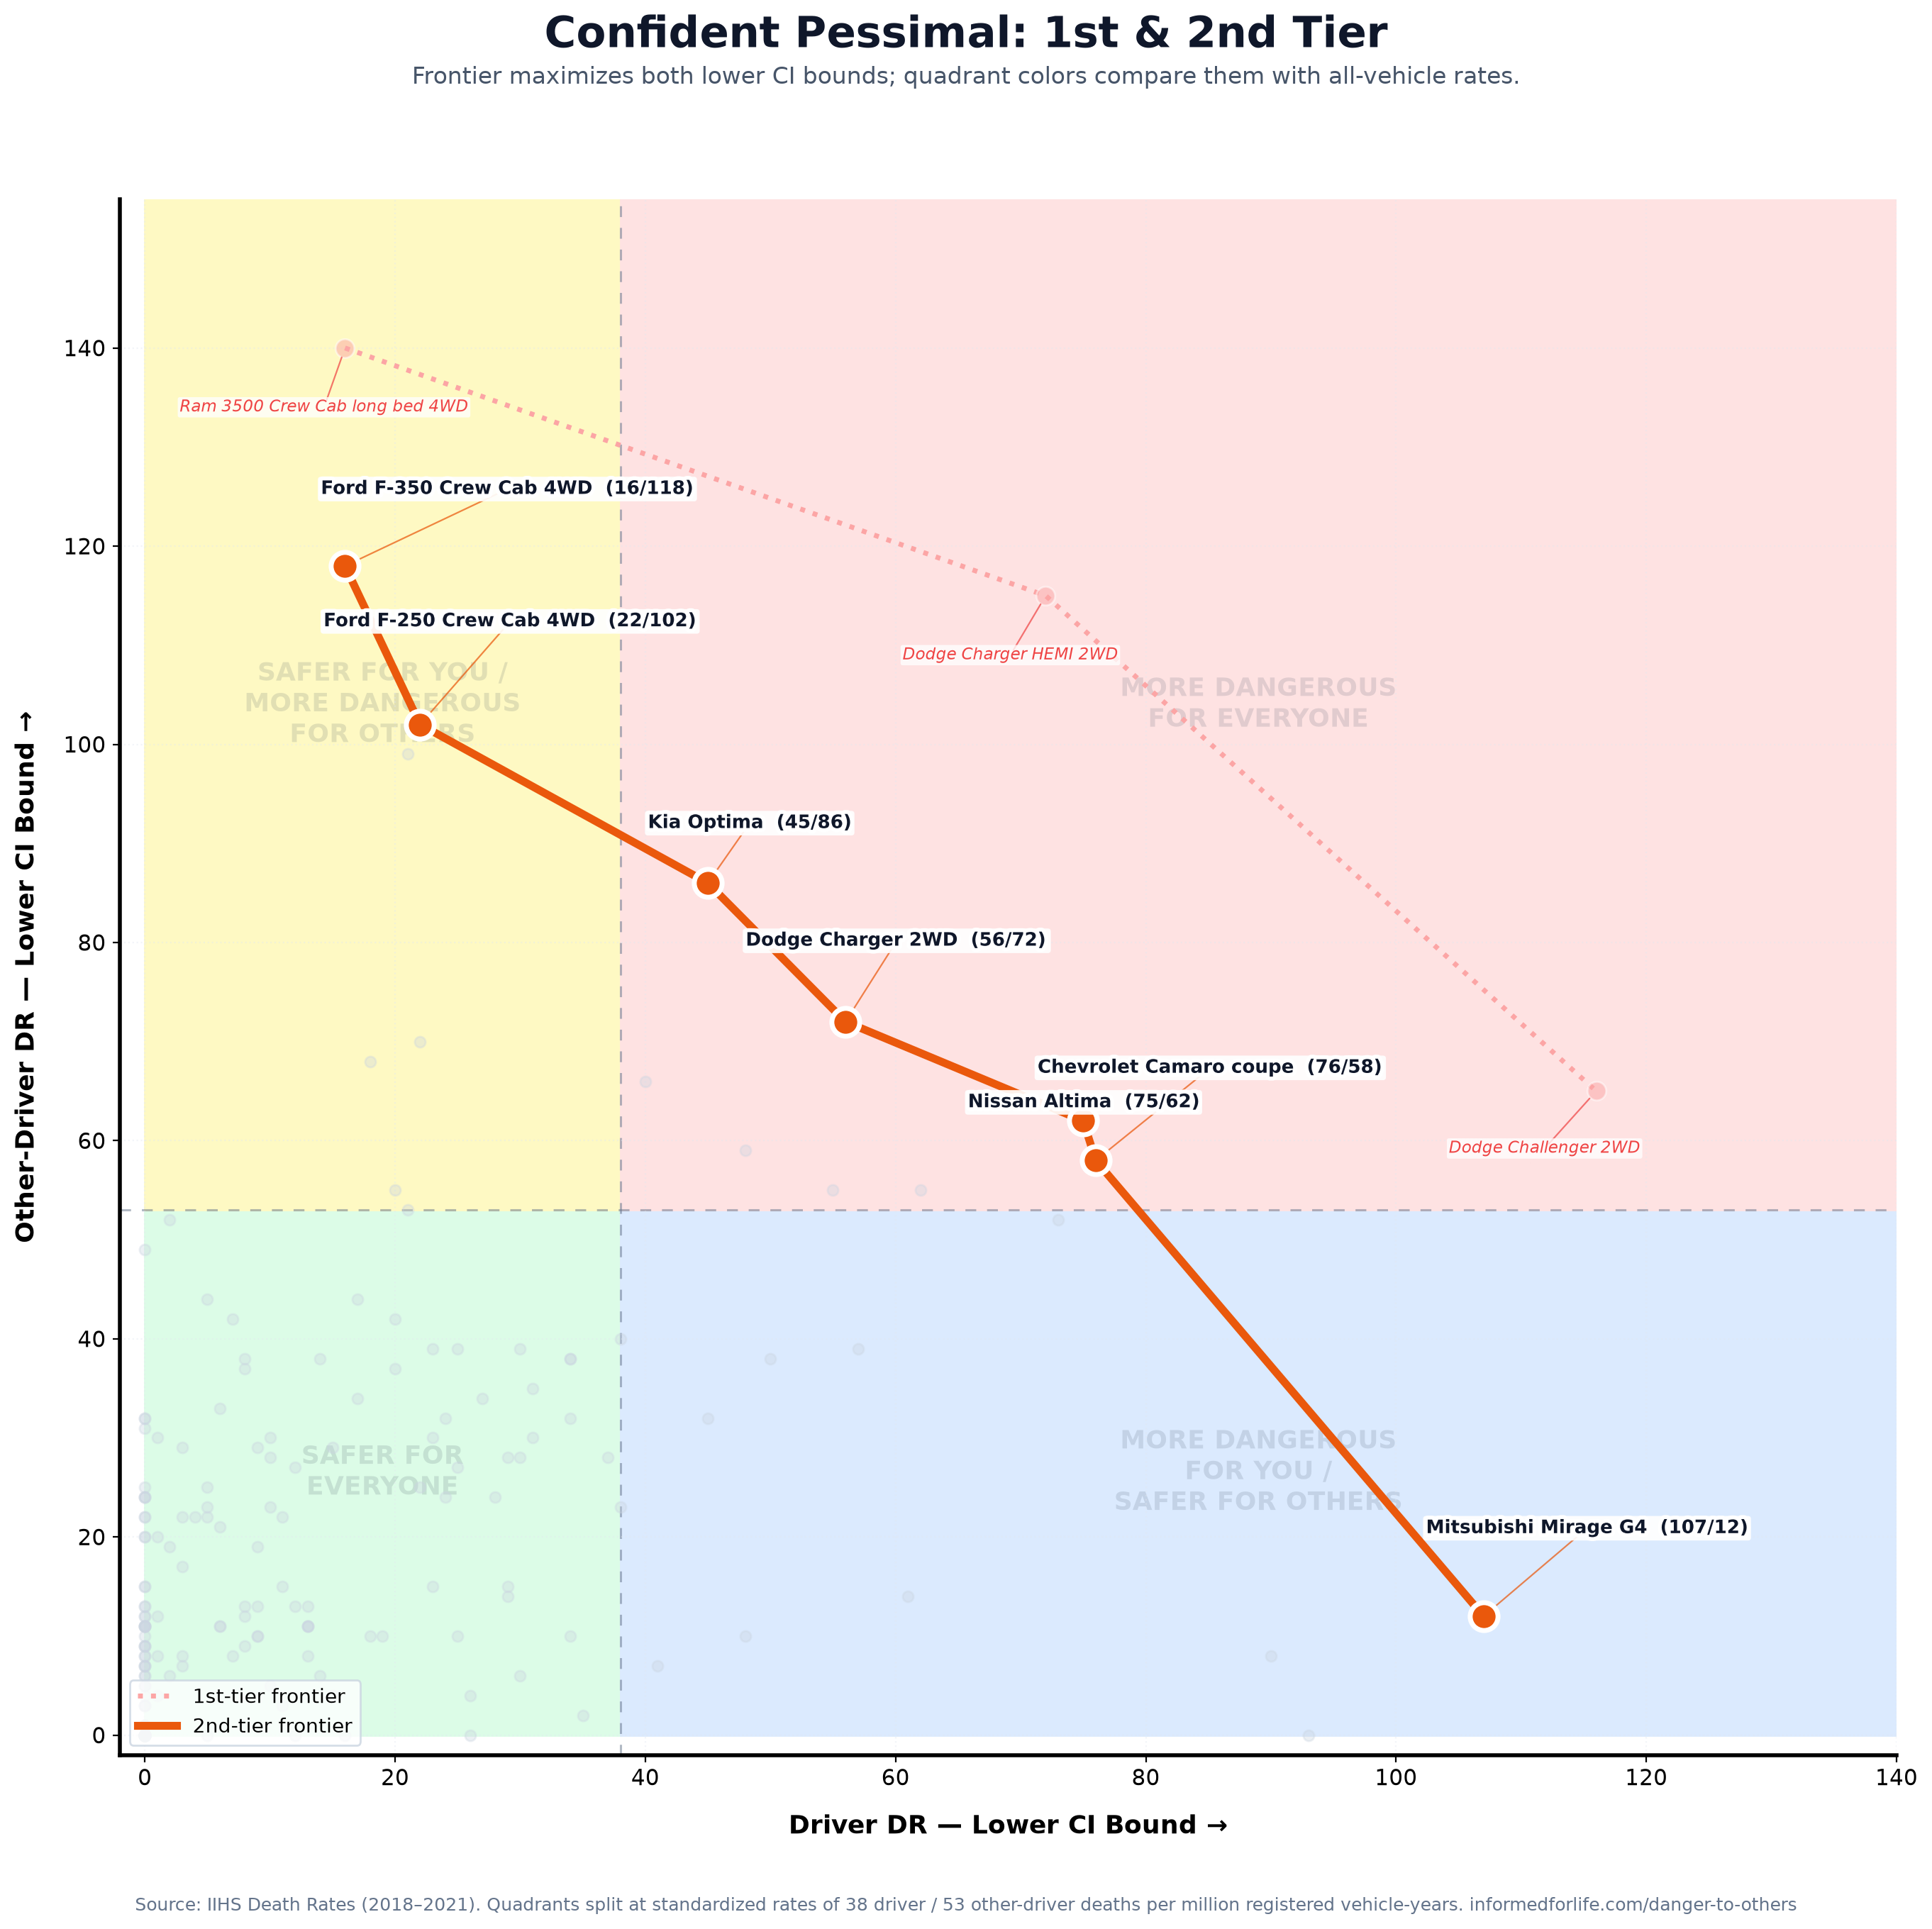
Tier 1 is the outer nondominated frontier. To calculate Tier 2, Tier-1 models are excluded only from that next calculation and the frontier is recomputed. Both tiers remain visible: Tier 1 is lighter so the Tier-2 labels remain readable.
Values printed beside Tier-2 models are the confidence-bound coordinates plotted in that chart—not the underlying point estimates. These are tradeoff boundaries, not precise rankings.
IIHS tracks not just how often your driver dies — but how often drivers of other vehicles die in crashes involving your car. The differences are staggering.
That's a 31× observed difference. This comparison applies specifically to drivers in other vehicles. Pedestrians and cyclists require separate measures, presented later on this page.
The overall other-driver death rate across all 2020 models: 53 per million registered vehicle years.
Source: IIHS Driver Death Rates by Make and Model (2020 models, 2018–2021 fatalities)
Size matters — but it's not the whole story. Driving behavior associated with certain vehicle types also plays a role.
Farmer (2024), standardized to a common case-driver age/gender mix. All-vehicle rate: 53 per million.
| Vehicle Class | Other-Driver Death Rateper million reg. years |
Aggressivity Factor× average |
Other-to-Own Driver Ratioother rate ÷ driver rate |
|---|---|---|---|
| Very Large Pickups | 121 | 2.28× | 3.9 : 1 |
| Large Cars (Challenger, Charger, Camaro) | 88 | 1.66× | 0.9 : 1 |
| Large Sports Cars | 77 | 1.45× | 0.8 : 1 |
| Luxury SUV Very Large | 67 | 1.26× | 3.7 : 1 |
| Large Pickups | 61 | 1.15× | 2.0 : 1 |
| Midsize Cars | 57 | 1.08× | 0.9 : 1 |
| Car Mini | 55 | 1.04× | 0.4 : 1 |
| Midsize Sports Cars | 55 | 1.04× | 0.7 : 1 |
| Nonluxury SUV Large | 54 | 1.02× | 2.7 : 1 |
| Nonluxury SUV Very Large | 52 | 0.98× | 2.2 : 1 |
| Small Cars | 50 | 0.94× | 0.9 : 1 |
| Nonluxury SUV Midsize | 49 | 0.92× | 1.8 : 1 |
| Minivans | 49 | 0.92× | 1.8 : 1 |
| Small Pickups | 46 | 0.87× | 1.5 : 1 |
| Nonluxury SUV Small | 43 | 0.81× | 1.0 : 1 |
| Luxury SUV Large | 35 | 0.66× | 2.1 : 1 |
| Luxury Midsize | 34 | 0.64× | 1.5 : 1 |
| Luxury Large | 34 | 0.64× | 1.6 : 1 |
| Luxury SUV Small | 32 | 0.60× | 0.7 : 1 |
| Wagon Small | 31 | 0.58× | 1.1 : 1 |
| Luxury SUV Midsize | 30 | 0.57× | 2.7 : 1 |
| Wagon Mini | 28 | 0.53× | 0.6 : 1 |
| Luxury Very Large | 25 | 0.47× | 6.3 : 1 |
| Wagon Midsize | 23 | 0.43× | 4.6 : 1 |
| Small Sports Cars | 11 | 0.21× | 0.4 : 1 |
The ratio compares each class's standardized other-driver death rate with its standardized own-driver death rate. A value above 1.0 means the other-driver rate is higher.
Very large pickups have the largest asymmetry: their other-driver rate is 3.9 times their own-driver rate. Minicars show the opposite pattern at 0.4:1. This is a comparison of rates, not a count of paired deaths in the same crashes.
Source: Farmer, C.M. (2024). Demographic adjustments to driver death rates by vehicle type and size. Traffic Injury Prevention, 25(2), 173–181, Tables 1–2. Rates standardized using case-vehicle driver age and gender (2017–2020 models equivalent to model year 2020; 2018–2021 fatalities).
Individual models vary enormously — even within the same vehicle class.
| Model | Rate | 95% interval |
|---|---|---|
| Ram 3500 Crew Cab long bed 4WD | 189 | 140–239 |
| Dodge Charger HEMI 2WD | 164 | 115–213 |
| Ford F-350 Crew Cab 4WD | 147 | 118–176 |
| Ram 2500 Mega Cab 4WD | 145 | 70–220 |
| Kia Optima | 134 | 86–182 |
| Kia Rio sedan | 133 | 59–207 |
| Ram 2500 Crew Cab short bed 4WD | 122 | 99–146 |
| Ford F-250 Crew Cab 4WD | 120 | 102–139 |
| Model | Rate | 95% interval |
|---|---|---|
| Buick Encore 4WD | 6 | 0–19 |
| Mercedes-Benz E-Class sedan 4WD | 10 | 0–24 |
| Acura MDX 4WD | 14 | 1–28 |
| Toyota RAV4 hybrid 4WD | 16 | 0–32 |
| Subaru Ascent | 16 | 0–33 |
| Volvo XC60 4WD | 16 | 0–39 |
| Porsche Macan | 18 | 1–35 |
| Lexus NX 300 4WD | 19 | 0–48 |
Lighter, lower vehicles tend to have lower other-driver death rates. Separate pedestrian studies also find that lower, more sloped front ends reduce severe head and torso impacts; those studies use different outcomes and denominators.
Source: IIHS — Latest driver death rates highlight dangers of muscle cars, July 2023. Deaths of people in other vehicles per million registered years, across the 181 models IIHS publishes both figures for. The intervals are wide enough that neighbouring rows are rarely distinguishable from one another.
When a car hits a pedestrian, the height and shape of the front end determines whether they go over the hood or under the wheels.
| Hood Height / Shape | Pedestrian Fatality Risk | Compared to Low + Sloped |
|---|---|---|
| > 40 inches (tall front) | Highest | +45% more fatalities |
| 30–40 inches, blunt front | Elevated | +26% more fatalities |
| < 30 inches, sloped (sedans, sports cars) | Baseline | — |
Source: Hu et al., 2024 — IIHS study on hood height and pedestrian fatality risk
Taller front ends don't just add risk — they multiply it at higher speeds:
Source: Monfort & Mueller, 2025 — IIHS pedestrian injury severity by vehicle type and speed
After decades of progress, pedestrian fatalities reversed course in 2009 — right as the SUV and truck boom accelerated.
| Factor | What Changed | Impact |
|---|---|---|
| Vehicle size | Average vehicle became wider, longer, taller, and heavier over 30 years | More lethal impacts |
| Hood height | Hoods got 3–6 inches taller on average | Strikes chest/head instead of legs |
| SUV/truck market share | SUVs went from ~30% to ~55% of new sales | More tall-front vehicles on road |
| Distracted driving | Smartphone use while driving | Slower reaction to pedestrians |
| Fatal crashes at night | 75% of pedestrian fatalities occur after dark | Visibility challenges |
Fatal single-vehicle pedestrian crashes involving SUVs increased 81% between 2009 and 2016 — more than any other vehicle type. The correlation between fleet composition and pedestrian deaths is not a coincidence.
Source: Hu & Cicchino, 2018 — IIHS study on pedestrian crash trends
Larger vehicles create larger blind spots — and the data shows they kill more pedestrians specifically when turning.
SUVs and pickups are substantially more likely to hit pedestrians when making turns vs. traveling straight — compared to cars
| Design Feature | What It Does |
|---|---|
| Wider A-pillars | Required for roof crush strength in rollovers — but blocks driver's view of crossing pedestrians |
| Higher ride height | Children and shorter adults disappear below the sight line |
| Longer front end | Creates a larger area ahead of the driver that's completely invisible |
| Larger dashboard | Reduces forward-down visibility angle |
Source: IIHS — Big blind zones linked to left-turn crashes, November 2025; Hu & Cicchino, 2022
Regulators and safety organizations are finally catching up to the pedestrian crisis.
| Initiative | What It Does | Status |
|---|---|---|
| IIHS Pedestrian AEB Testing | Tests automatic emergency braking for pedestrian detection — day and night | Active (required for TSP+ since 2024) |
| NHTSA Pedestrian Crashworthiness | Proposed rule requiring hood designs that reduce pedestrian head injuries | Proposed (targeting large SUVs/pickups) |
| European NCAP | Already tests pedestrian protection — hood/bumper impact zones | Active since 2009 |
| Pop-Up Hoods | Hoods lift 2–3 inches on impact, creating space between head and engine | Deployed by Volvo, Mercedes, others |
| Pedestrian Hood Airbags | Airbag deploys over windshield base and A-pillars upon pedestrian impact | Available on select models |
| IIHS 30x30 Initiative | Goal to reduce traffic deaths 30% by 2030 — includes pedestrian measures | Active |
The good news: Pedestrian automatic emergency braking (AEB) is increasingly standard. Since 2024, the IIHS requires both daytime and nighttime pedestrian AEB testing for Top Safety Pick+ — meaning the safest new cars are also getting better at protecting people outside the car.
Being a responsible road user means considering the safety of others — not just yourself.
| Action | Why It Matters |
|---|---|
| Choose a vehicle with a lower hood | Every inch of hood height below 40" reduces pedestrian fatality risk |
| Look for Pedestrian AEB (Superior rating) | Systems that detect and brake for pedestrians — especially at night |
| Slow down in pedestrian areas | At 30 mph, a pickup creates 76% serious injury risk vs 37% for a car. Speed kills disproportionately in larger vehicles |
| Extra caution when turning | If you drive a truck or SUV, you have larger blind zones — look twice before turning |
| Don't buy more vehicle than you need | If you don't tow, haul, or go off-road, a large truck puts others at unnecessary risk |
| Consider pop-up hood / pedestrian airbag options | Available on Volvo, Mercedes, Subaru — these technologies save lives |
A February 2025 IIHS study found that for vehicles above the fleet average of ~4,000 lbs, every additional 500 lbs only reduces the driver's death risk by 1 per million — but increases the risk to other drivers by 7. For lighter vehicles, the same 500 lbs saves 17 lives per million while adding only 1 partner death.
The takeaway: Choosing a supersized truck doesn't make you safer, but it makes everyone else on the road less safe. Learn how to choose a car that's safe for you and others →
The best vehicles score high on occupant protection and have low other-driver death rates. See our data-driven rankings.
Most Dangerous Cars → | Insurance Losses → | Vehicle Theft →
Our rankings, tables, and charts may be quoted or republished with a link back to this page. Underlying crash-test and death-rate data belong to IIHS, HLDI, and NHTSA; see how we rank.